Contenu

Extremwertanalysen

Extremwertanalysen für Stationen in den vom Niederschlagsereignis vom 30. April - 4. Mai 2015 betroffenen Regionen.

Pied de page

Navigation top bar

Toutes les autorités fédérales

Navigation des services

Wiederkehrperioden der 5-Tages-Niederschlagssumme vom 30. April - 4. Mai

Bei diesem Ereignis erfolgten aussergewöhnlich hohe Niederschlagsmengen am Fuss und im Jura, im Mittelland, im Berner Oberland und in den Waadtländer Alpen. An einigen Stationen in diesen Regionen wurden zwischen 30. April und 4. Mai 2015 Niederschlagsmengen gemessen, die einem 10- bis 100-jährlichen Ereignis entsprechen.

Die zwischen 30. April und 4. Mai gemessene 5-Tages-Niederschlagsmenge war am höchsten an den Stationen Herzogenbuchsee (BE, 143,2 mm) und Château-d’Oex (VD, 150,9 mm) mit entsprechenden Wiederkehrperioden von 50 bis 100 Jahren. Die Mengen waren weniger hoch an den Stationen im Jura und in der Region Chablais. Diese entsprechen „nur“ einem 10- bis 50-jährlichen Ereignis.

Map of Switzerland with, in colored circles, the return periods of the 5-day precipitation for 30 April to 4 May 2015.

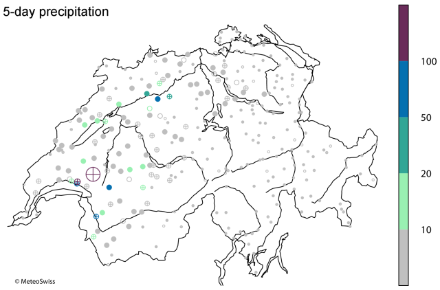
Die 5-Tages-Niederschlagssumme wurde zwischen dem 30. April 2015, 05:40 UTC und dem 5. Mai 2015, 05:40 UTC gemessen. Die Wiederkehrperioden basieren auf den Schätzungen der verallgemeinerten Extremwertverteilung aus den 5-Tages-Niederschlags-Jahresmaxima der Periode 1961-2010. Der Durchmesser der Kreise ist proportional zum Wert der Wiederkehrperiode. Die Füllung der Kreise zeigt die Zuverlässigkeit der Statistik an: gut (gefüllter Kreis), fragwürdig (Kreis mit Kreuz) und schlecht (leerer Kreis).

Wiederkehrperioden der höchsten 4-, 3-, 2- und 1-Tages-Niederschlagssummen

Da sich die meisten Niederschläge nur zwischen 30. April und 3. Mai ereigneten, sind die Wiederkehrperioden der höchsten 4-Tages-Niederschlagsmengen leicht höher als bei den 5-Tages-Niederschlagsmengen, d. h. zwischen 10 und 100 Jahren. Die höchste 4-Tages-Niederschlagsmenge wurde an der Station Herzogenbuchsee (139,4 mm) gemessen und entspricht einem 50- bis 100-jährlichen Ereignis. Niederschlagsmengen mit einer Wiederkehrperiode von 20 bis 50 Jahren wurden am Jurafuss (Riedholz-Wallierhof SO: 185,2 mm; Combe-Garot NE: 133,2 mm), im Berner Oberland (Boltigen: 168,8 mm) sowie in den Waadtländer Alpen (Gryon: 132,5 mm) und in der Region Chablais (Bex: 107,1 mm) gemessen.

Die höchsten während dieses Ereignisses gemessenen 3-, 2- und 1-Tages-Niederschlagsmengen waren weniger aussergewöhnlich als die höchsten 4-Tages-Niederschlagsmengen an einer bestimmten Anzahl Stationen auf der Alpennordseite. Sie entsprechen Wiederkehrwerten mit einer Wiederkehrperiode von 10 bis 50 Jahren. Somit scheint es so, dass nicht nur die hohen Niederschlagsmengen, die am 1. Mai in der Form von Regen niedergingen (siehe Abschnitt Niederschlag und Temperatur), sondern auch die über mehrere Tage andauernden Regenfälle dazu beigetragen haben, dass dieses Ereignis an diesen Stationen als extrem einzustufen ist.

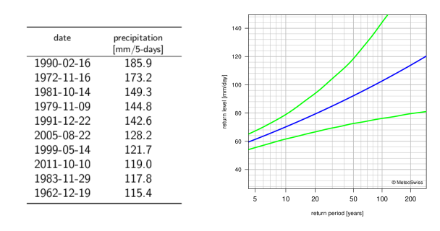
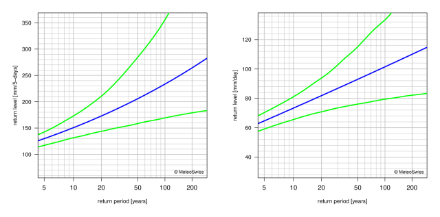
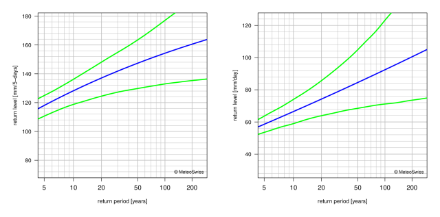
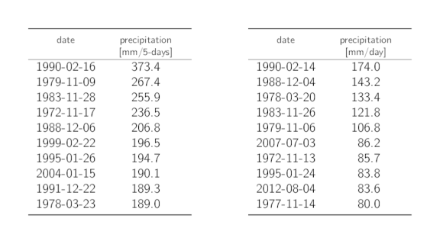
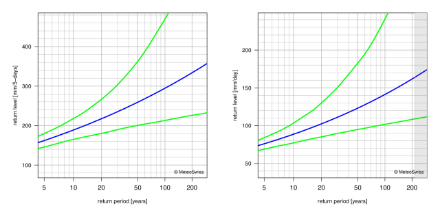
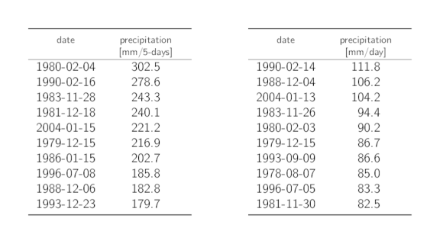
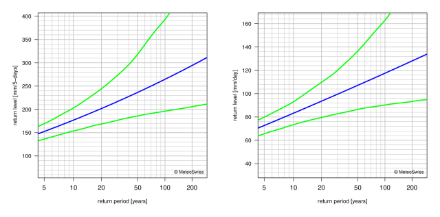
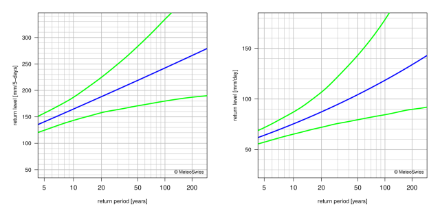
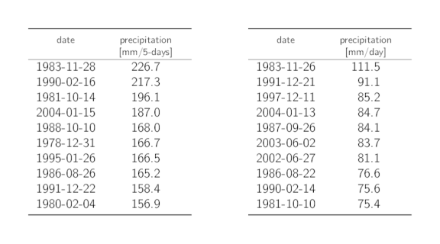
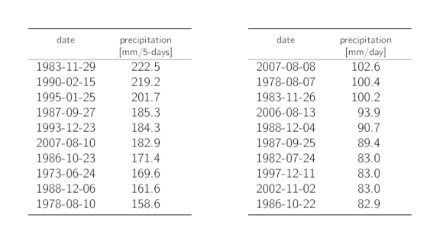
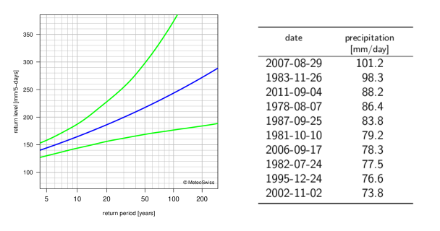
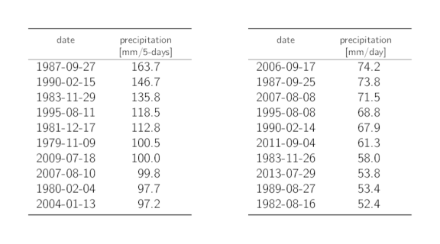
Extremwertanalysem der 5- und 1 Tages-Niederschläge

In diesem Abschnitt wird die Extremwertanalyse für die im Abschnitt Hyetogramme aufgeführten Stationen erörtert. Mangels ausreichender Daten werden hier nicht alle Stationen aufgeführt. Die statistischen Daten wurden auf Basis der Periode von 1961 bis 2010 erhoben. Die Diagramme der Wiederkehrwerte der 5-Tages- und 1-Tages-Niederschlags-Maxima sind aufgeführt, wenn die statistischen Daten zuverlässig sind. Wenn die statistischen Daten nicht zuverlässig sind oder die Dauer der Aufzeichnungen zu kurz ist, werden stattdessen Tabellen der zehn höchsten Niederschlags-Maxima ab Beginn der Messungen bis 2014 aufgeführt. Diese können für einen Vergleich mit den Niederschlagsmengen unter Abschnitt Niederschlag und Temperatur. Zudem sind PDF-Dateien der Extremwertanalysen verfügbar, wenn die Zuverlässigkeit der Ergebnisse gut oder zweifelhaft ist.

Adelboden
Left: table listing the dates of the 10 highest annual 5-day precipitation maxima with the corresponding precipitation sums. Right: return level plot for 1-day precipitation, showing, with lines, the best estimate for the return levels and the corresponding 95% confidence intervals.
Left: 10 highest annual 5-day precipitation maxima at station Adelboden between 1961 and 2014. Precipitation sums are calculated from 05:40 UTC of one day to 05:40 UTC of the following day. The date indicates the last entire day over which the precipitation is summed. Right: plot of return levels and their uncertainty (ordinate) for a given return period (abscissa) for 1-day precipitation. The return level estimates are given by the blue line, while the return level 95% confidence bounds are colored in green.

Boltigen
Return level plots showing, with lines, the best estimate for the return levels and the corresponding 95% confidence intervals.
Plots of return levels and their uncertainty (ordinate) for a given return period (abscissa) for 5-day (left) and 1-day (right) precipitation for station Boltigen. The return level estimates are given by the blue line, while their 95% confidence bounds are colored in green.

Château-d’Oex
Return level plots showing, with lines, the best estimate for the return levels and the corresponding 95% confidence intervals.
Plots of return levels and their uncertainty (ordinate) for a given return period (abscissa) for 5-day (left) and 1-day (right) precipitation for station Château-d’Oex. The return level estimates are given by the blue line, while their 95% confidence bounds are colored in green.

Col des Mosses
Tables listing the dates of the 10 highest annual 5-day and 1-day precipitation maxima with the corresponding precipitation sums.
10 highest annual 5-day (left) and 1-day (right) precipitation maxima at station Col des Mosses between 1972 and 2014. Precipitation sums are calculated from 05:40 UTC of one day to 05:40 UTC of the following day. The date indicates the last entire day over which the precipitation is summed.

Gsteig, Gstaad
Return level plots showing, with lines, the best estimate for the return levels and the corresponding 95% confidence intervals.
Plots of return levels and their uncertainty (ordinate) for a given return period (abscissa) for 5-day (left) and 1-day (right) precipitation for station Gsteig, Gstaad. The return level estimates are given by the blue line, while their 95% confidence bounds are colored in green.

La Dôle
Tables listing the dates of the 10 highest annual 5-day and 1-day precipitation maxima with the corresponding precipitation sums.
10 highest annual 5-day (left) and 1-day (right) precipitation maxima at station La Dôle between 1973 and 2014. Precipitation sums are calculated from 05:40 UTC of one day to 05:40 UTC of the following day. The date indicates the last entire day over which the precipitation is summed.

Magglingen
Return level plots showing, with lines, the best estimate for the return levels and the corresponding 95% confidence intervals.
Plots of return levels and their uncertainty (ordinate) for a given return period (abscissa) for 5-day (left) and 1-day (right) precipitation for station Magglingen. The return level estimates are given by the blue line, while their 95% confidence bounds are colored in green.

Montana
Return level plots showing, with lines, the best estimate for the return levels and the corresponding 95% confidence intervals.
Plots of return levels and their uncertainty (ordinate) for a given return period (abscissa) for 5-day (left) and 1-day (right) precipitation for station Montana. The return level estimates are given by the blue line, while their 95% confidence bounds are colored in green.

Morgins
Tables listing the dates of the 10 highest annual 5-day and 1-day precipitation maxima with the corresponding precipitation sums.
10 highest annual 5-day (left) and 1-day (right) precipitation maxima at station Morgins between 1975 and 2014. Precipitation sums are calculated from 05:40 UTC of one day to 05:40 UTC of the following day. The date indicates the last entire day over which the precipitation is summed.

Nesselboden
Tables listing the dates of the 10 highest annual 5-day and 1-day precipitation maxima with the corresponding precipitation sums.
10 highest annual 5-day (left) and 1-day (right) precipitation maxima at station Nesselboden between 1973 and 2014. Precipitation sums are calculated from 05:40 UTC of one day to 05:40 UTC of the following day. The date indicates the last entire day over which the precipitation is summed.

Riedholz-Wallierhof
Left: return level plot for 1-day precipitation, showing, with lines, the best estimate for the return levels and the corresponding 95% confidence intervals. Right: table listing the dates of the 10 highest annual 1-day precipitation maxima with the corresponding precipitation sums.
Left: plot of return levels and their uncertainty (ordinate) for a given return period (abscissa) for 5-day precipitation for station Riedholz-Wallierhof. The return level estimates are given by the blue line, while their 95% confidence bounds are colored in green. Right: 10 highest annual 1-day precipitation maxima between 1969 and 2014. Precipitation sums are calculated from 05:40 UTC of one day to 05:40 UTC of the following day.

Wynau
Tables listing the dates of the 10 highest annual 5-day and 1-day precipitation maxima with the corresponding precipitation sums.
10 highest annual 5-day (left) and 1-day (right) precipitation maxima at station Wynau between 1969 and 2014. Precipitation sums are calculated from 05:40 UTC of one day to 05:40 UTC of the following day. The date indicates the last entire day over which the precipitation is summed.